 |
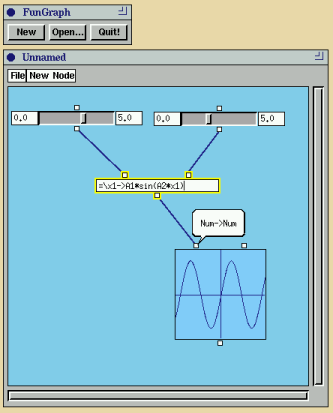
Figure 96. A screen dump of the program FunGraph. Two sliders controls
amplitude and frequency of a sine function defined in a
cell. This function is then visualised in a graph. The bubble
window (implemented by bubbleRootPopupF) shows the type
of the pin that the user points at for the moment, which
happens to be the left input pin of the graph object. It has
the type Num -> Num, which is the type of the functions
that the graph object can display.
The cell also shows the visual effect of one of the filter
fudgets in the library, which is called the shapeGroupMgr. The cell is currently being selected, which is
indicated by a yellow, glowing border around it. This effect
is achieved by wrapping a shaped window whose border tightly
follows the fudgets inside it (in this case three pin fudgets
and one stringF). The border of the shaped window is
yellow, and its width is set to zero when the object is
deselected, or a couple of pixels as is the case with our
cell. The shapeGroupMgr ensures that the shape of the
yellow-border window tightly follows the contour of the
wrapped fudgets by analysing the ConfigureWindow
commands that they output.